Atuin replaces your shell history with a searchable database: fuzzy matching, filter by directory, …
/user/kayd
@
devops
:~$
cat find-slow-queries-aurora-postgresql.md
Finding and Fixing Slow Queries in Aurora PostgreSQL Finding and Fixing Slow Queries in Aurora PostgreSQL


Karandeep Singh
• 12 minutes
Summary
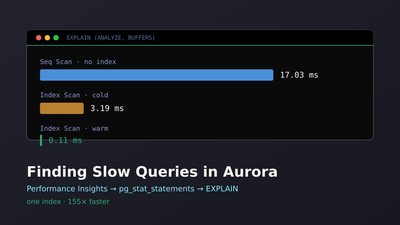
How to find slow queries in Aurora PostgreSQL the way you actually would, starting in the AWS console with Performance Insights and CloudWatch, then dropping into pg_stat_statements and EXPLAIN to fix one query from 17 ms to 0.1 ms.
A cache helps with repeated reads, but the database query itself can be slow, and no cache saves you on the first hit or a cache miss. This article is about finding slow queries in Aurora PostgreSQL and fixing them, and it starts where someone new to AWS actually should: the web console. We’ll use Performance Insights and CloudWatch to spot the offender, then drop into pg_stat_statements and EXPLAIN to diagnose and fix it, taking one query from 17 ms to 0.1 ms with a single index. I’ll use the same 100,000-row products table from the Aurora setup and cache-aside articles.
Prerequisites: an Aurora PostgreSQL cluster you can reach with
psql from an EC2 box in the same VPC (see the Aurora setup guide), and a table with enough rows that slowness is real. Performance Insights is enabled by default.Reach for AWS’s tools before psql
As a developer, your instinct when a query is slow is to open psql, run EXPLAIN ANALYZE, and start reading query plans. Hold that thought. On Aurora, AWS gives you tools that answer the first two questions faster: which query is slow, and why it’s slow (CPU, disk, or lock contention). You still end up in psql eventually, but you’ll get there knowing exactly what to look at instead of guessing.
There are three places you’ll spend your time, all reachable from the AWS web console. Let’s get oriented before touching anything.
1. The RDS console, where your database lives
Aurora isn’t a separate service in the AWS console; it’s part of RDS (Relational Database Service), Amazon’s managed-database offering. To get there, sign in and type “RDS” into the search bar at the top of the console, or go to console.aws.amazon.com/rds.
Before you do anything else, check the Region in the top-right corner of the console. AWS scopes almost everything to a region, and you’ll only see your resources if you’re in the right one. For this series that’s US East (N. Virginia), us-east-1. If it says something else, switch it there.
Now click Databases in the left sidebar. You’ll see your cluster, database-1. A quick vocabulary note, because AWS’s terms trip up newcomers:
- A cluster is Aurora’s storage plus one or more compute nodes.
- Each compute node is a DB instance. Yours is a single
db.t3.medium, the writer instance, which handles both reads and writes since there are no read replicas. db.t3.mediumis a burstable instance class: it runs at a baseline CPU level and dips into a credit balance for short spikes. That detail matters later, so keep it in mind.
Click into database-1 and you’ll land on the cluster’s detail page, with tabs across the top including Monitoring, Connectivity & security, and Configuration.
2. Performance Insights, which queries are loading the database
Performance Insights is the tool that actually finds your slow queries. It samples what the database is doing once a second and rolls that up into a single picture of database load. It’s already turned on for your cluster, so there’s nothing to configure.
AWS is folding Performance Insights into Amazon CloudWatch Database Insights. As of July 31, 2026 the standalone Performance Insights console is retired, and the same dashboard, database load, Top SQL, and wait events, moves under CloudWatch → Database Insights. Your data, retention, and pricing carry over unchanged; only the navigation moves, so everything below works the same in either place. If the RDS console shows a “Go to Database Insights” banner, that button is the new home.
Open it from the RDS console (Performance Insights in the left sidebar, or the Monitoring dropdown on the instance page), or via CloudWatch → Database Insights. Either way, pick your writer DB instance from the selector at the top.
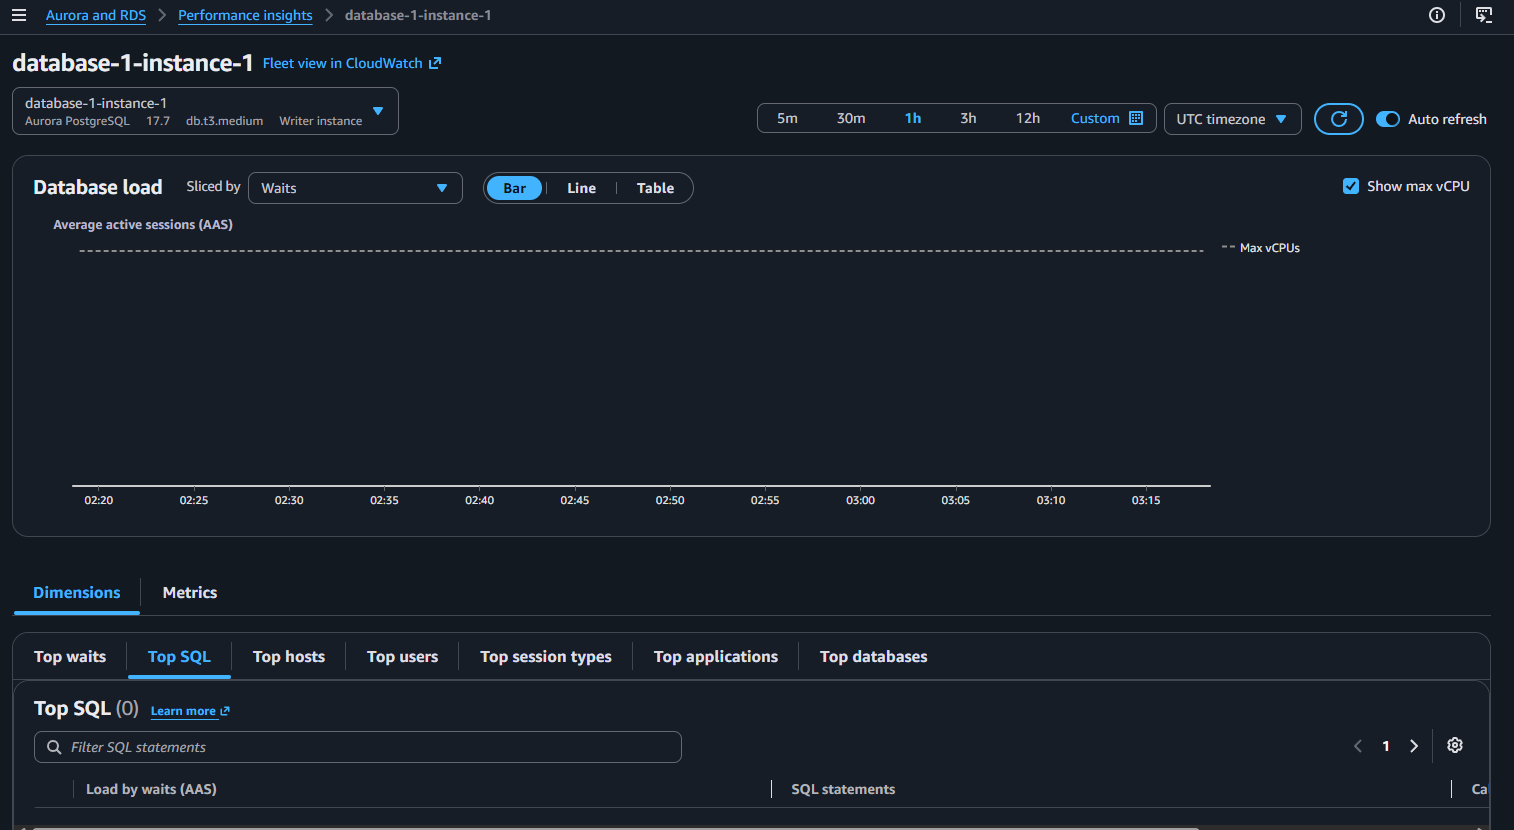
Performance Insights works per instance, not per cluster. Pick the writer instance (the
db.t3.medium), not the cluster name, or the dashboard will look empty. On a single-instance setup like this, there’s only one real choice, but the distinction bites you the moment you add a read replica.The main chart is Database load, and its y-axis is Average active sessions (AAS), roughly, the average number of queries actively running or waiting at any given moment. The dashed horizontal line labeled Max vCPU marks how many virtual CPUs the instance has (2, for your db.t3.medium). The rule of thumb: when the load bars sit above the Max vCPU line for a sustained period, the database is asking for more CPU than it has, and things queue up.
The colors in the chart come from a Slice by control. By default it slices by wait state, what queries are stuck waiting on. For Aurora PostgreSQL these are standard Postgres wait events, with names like CPU, IO:DataFileRead (reading pages from storage), Lock:transactionid (waiting on a row lock), and Client:ClientRead (waiting on the application). A tall stack of IO:DataFileRead points at a missing index or an unselective scan; a lot of Lock:* points at contention, not slow SQL.
Below the chart is a set of tabs, Top SQL, Top waits, Top hosts, Top users, Top databases. Top SQL is the one you’ll live in: it ranks statements by how much load they contribute, and you can add columns such as calls per second, rows per second, and average latency per call. That ranking is your shortlist of queries to investigate. (Under the hood, Performance Insights reads query text and stats from the pg_stat_statements extension, which we’ll meet shortly.) You get the last 7 days of history for free.
3. CloudWatch, the health of everything around the query
CloudWatch is AWS’s general-purpose metrics and monitoring service. Where Performance Insights tells you which query is expensive, CloudWatch tells you whether the instance itself is healthy, CPU, memory, connections, I/O. The two answer different questions, and you’ll cross-check them.
The quickest way in is the Monitoring tab on the instance’s detail page in the RDS console, which embeds the relevant CloudWatch graphs. You can also open the full CloudWatch console (search “CloudWatch”) for custom time ranges and alarms. The metrics you’ll actually use for slow-query work:
- CPUUtilization — percentage of CPU in use. Pair this with the Max vCPU signal from Performance Insights.
- DatabaseConnections — open connections; a runaway count often accompanies pile-ups.
- FreeableMemory — available RAM. When this drops low, Postgres reads more from storage instead of cache, and queries slow down.
- ReadLatency / WriteLatency — average time per storage I/O operation.
- CPUCreditBalance — because your
db.t3.mediumis a burstable instance. If this balance drains to zero, the instance is throttled and everything gets slow regardless of query quality. Always rule this out first on a T-class instance before blaming a query.
CloudWatch’s standard RDS metrics are sampled once per minute, so a query that pins the CPU for 15 seconds can vanish inside a 1-minute average. CloudWatch tells you when and how hard the database was stressed; it does not tell you which query. For that, use Performance Insights. Its DB load graph is the very same number as the CloudWatch DBLoad metric, average active sessions, but broken down by the exact SQL and wait events behind it. You can also set a CloudWatch alarm (for example, CPU over 80% for 5 minutes) to email you via an SNS topic, so you’re paged instead of watching graphs.
How they fit together
The workflow for the rest of this article is straightforward:
- Performance Insights → Top SQL to find the query worth fixing and see what it’s waiting on.
- CloudWatch to confirm the instance itself isn’t the problem (out of CPU credits, out of memory, connection storm).
psqlwithEXPLAIN (ANALYZE, BUFFERS)to read the plan for that specific query and fix it.
Start at the top of that list, not the bottom. The console tells you where to point psql, which saves you from optimizing a query that was never the real cause.
Expand your knowledge with The DevOps Stack I'd Pick If I Started Over in 2026
Catch a query in Performance Insights (hands-on)
Orientation done, let’s actually catch one. Performance Insights samples once a second, so a single fast query won’t register, we need the database busy for a minute. From the EC2 box, run an un-indexed, full-scan query in a loop:
export RDSHOST="database-1.cluster-xxxxxxxx.us-east-1.rds.amazonaws.com"
END=$((SECONDS+120))
while [ $SECONDS -lt $END ]; do
  psql "host=$RDSHOST port=5432 dbname=postgres user=postgres sslmode=verify-full sslrootcert=./global-bundle.pem" \
    -c "SELECT count(*) FROM products WHERE name LIKE '%9%';" >/dev/null
done
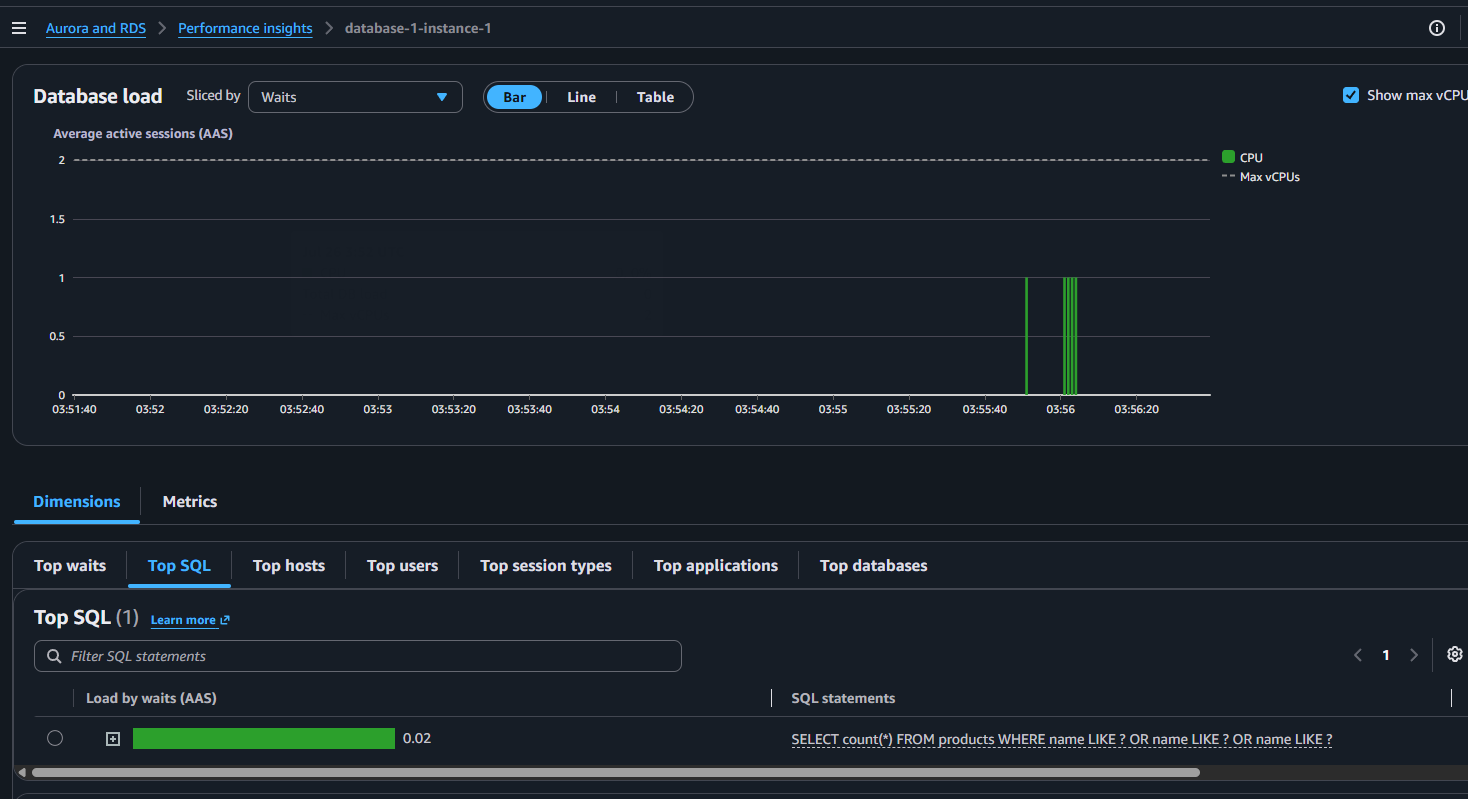
While it runs, open Performance Insights, set the time range to the last 5 minutes, and make sure the load chart is sliced by Top SQL. The SELECT count(*) … LIKE '%9%' statement climbs to the top of the list, and because it’s a full table scan, its load is almost entirely CPU. That’s your suspect: click it, copy the SQL, and take it to EXPLAIN. This is the console-first loop in miniature, the dashboard hands you the query, and now you go diagnose it.
Deepen your understanding in Mastering NGINX Logs: Configuration and Analysis Guide
Rank queries precisely with pg_stat_statements
Performance Insights is the visual view; pg_stat_statements is the precise, in-database one. It records stats for every query, how often it ran, total time, mean time, rows returned. On Aurora it’s preloaded, so you just create the extension (connect with psql first):
CREATE EXTENSION IF NOT EXISTS pg_stat_statements;
If you try
SELECT pg_stat_statements_reset(); on Aurora you’ll get permission denied for function. That’s expected: the master user is an rds_superuser, not a full Postgres superuser, so it can’t reset the global stats. You don’t need to, just filter to your own queries instead.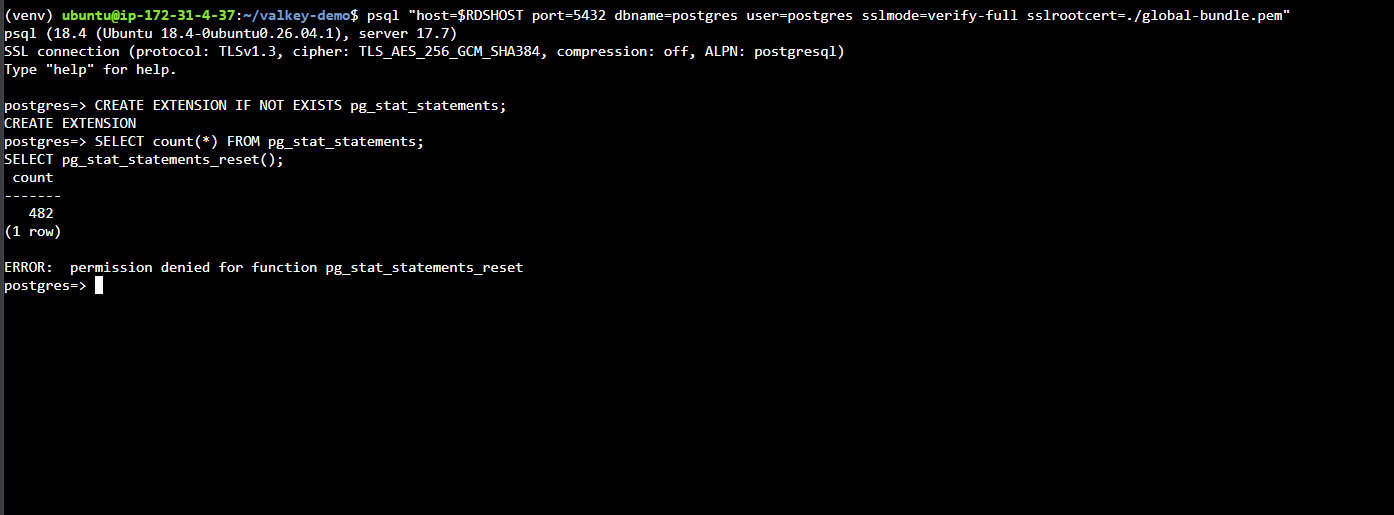
After running a few queries against products, ask which ones cost the most on average:
SELECT calls,
       round(total_exec_time::numeric, 1) AS total_ms,
       round(mean_exec_time::numeric, 2)  AS mean_ms,
       rows,
       query
FROM pg_stat_statements
WHERE query ILIKE '%products%'
ORDER BY mean_exec_time DESC
LIMIT 5;
The WHERE query ILIKE '%products%' filters out all the system and catalog noise so you only see your app’s queries. In my run the repeatable offender stood out clearly:
 calls | total_ms | mean_ms | rows  |                         query
-------+----------+---------+-------+--------------------------------------------------------
     3 |     55.4 |   18.47 |    30 | SELECT id, name, price FROM products
       |          |         |       | WHERE category = $1 ORDER BY price DESC LIMIT $2
One-time statements like the initial INSERT will also show up with big numbers, ignore those; you care about queries that run often (high calls) or are slow every time (high mean_ms). This top-10 query is both a real pattern and 18 ms each time, so it’s the one to fix.
Explore this further in Stop Pressing the Up Arrow: Searchable Shell History with Atuin
Read the plan with EXPLAIN ANALYZE
EXPLAIN (ANALYZE, BUFFERS) actually runs the query and shows how Postgres executed it:
EXPLAIN (ANALYZE, BUFFERS)
SELECT id, name, price FROM products WHERE category = 'electronics' ORDER BY price DESC LIMIT 10;
Before any index, the plan was:
 Limit  (actual time=16.995..16.997 rows=10)
   ->  Sort  (actual time=16.993..16.994 rows=10)
         Sort Key: price DESC
         Sort Method: top-N heapsort  Memory: 26kB
         ->  Seq Scan on products  (actual time=0.008..12.340 rows=20000)
               Filter: (category = 'electronics'::text)
               Rows Removed by Filter: 80000
 Execution Time: 17.031 ms
Read it bottom-up, and two lines jump out:
Seq Scan on products … Rows Removed by Filter: 80000— Postgres read all 100,000 rows and threw away the 80,000 that weren’t electronics.Sort … top-N heapsort— then it sorted the 20,000 survivors to find the 10 most expensive.
Reading the whole table and sorting it is why the query takes 17 ms.
Discover related concepts in Livestream From Your Phone to AWS with IVS (and What Every Setting Means)
Fix it with the right index
The query filters on category and sorts by price DESC. An index on exactly those columns, in that order, lets Postgres skip both the scan and the sort:
CREATE INDEX idx_products_category_price ON products (category, price DESC);
Run the same EXPLAIN again and the plan changes completely:
 Limit  (actual time=0.064..0.085 rows=10)
   ->  Index Scan using idx_products_category_price on products
         Index Cond: (category = 'electronics'::text)
 Execution Time: 0.110 ms
No Seq Scan. No Sort. Postgres walks the index straight to electronics, already ordered by price, and grabs the first 10. The result:
Seq scan (no index):     17.03 ms
Index scan (cold index):  3.19 ms   (first run, index pages read from disk)
Index scan (warm):        0.11 ms   (~155x faster than the seq scan)
CREATE INDEX is not the number to quote. Benchmark the warm run.That first index run (3 ms) still paid a one-time cost to read the new index pages from disk; the warm run at 0.11 ms is the true steady state. The index stores rows grouped by category and ordered by price, so “top 10 electronics by price” becomes a lookup instead of a scan-and-sort of 20,000 rows.
Uncover more details in Sed vs Awk vs Grep: When to Use Which (with Decision Matrix)
Indexes are not free. Each one adds storage and slows down writes (every
INSERT/UPDATE must maintain it). Index the columns your slow, frequent queries actually filter and sort on, not every column. And note that a leading-wildcard search like name LIKE '%9%' can’t use a normal b-tree index at all, that kind of query needs a different tool (a trigram index, or full-text search). Use pg_stat_statements to prove a query is worth an index before adding one.Index, cache, or both?
This series built a Valkey cache in front of Aurora, and now an index on Aurora itself. They solve different halves of the same problem:
- The index makes the query fast at the database, every time, including cache misses and writes-then-reads.
- The cache avoids hitting the database at all for repeated identical reads.
In production you usually want both: a well-indexed database so no single query is slow, and a cache so the database isn’t asked the same question a thousand times. Fix the query first (an index is cheap and permanent), then cache what’s still hot.
Journey deeper into this topic with I Gave My Blog an MCP Server (and You Can Too)
Wrapping up
Finding slow queries isn’t guesswork, and on AWS it doesn’t start in psql. Open Performance Insights, read Top SQL to see which query is loading the database and what it’s waiting on, glance at CloudWatch to rule out an unhealthy instance, then take the culprit into pg_stat_statements and EXPLAIN (ANALYZE, BUFFERS). Watch for a Seq Scan throwing away most rows, add the matching index, and confirm the plan flips to an Index Scan. A 17 ms query became a 0.1 ms one with a single line of SQL. For the shell and Python around all this, see my Ubuntu Terminal cheatsheet and Python Basics & CLI cheatsheet.
Enrich your learning with Adding an AWS Region to Aurora PostgreSQL (Global Database)
References and Further Reading
- Amazon Web Services. Amazon RDS Performance Insights.
- Amazon Web Services. Monitoring Amazon Aurora with CloudWatch.
- PostgreSQL. pg_stat_statements.
- PostgreSQL. Using EXPLAIN.
Question
What's the first place you look when a query is slow, the AWS console or straight into the database?
Similar Articles
Related Content
More from cloud
Cut AWS Lambda cost: what you are actually billed for, why more memory is rarely cheaper, the exact …
How I turned a Hugo blog into a public MCP server on Netlify — tools, resources and prompts over a …
You Might Also Like
Livestream from your phone with Amazon IVS and no code, with every channel setting explained: …
Design an AWS Lambda system for a million users an hour: capacity math, concurrency, cold starts, …
Knowledge Quiz
Test your general knowledge with this quick quiz!
A set of multiple-choice questions to test your knowledge.
Take as much time as you need.
Your score will be shown at the end.
Question 1 of 5
Score: 0
Quiz Complete!
Your score: 0 out of 5
Loading next question...
Contents