Learn kubectl annotate step by step: add, overwrite and remove annotations, record …
/user/kayd
@
devops
:~$
cat mastering-cpu-cores.md
CPU Monitoring: From Linux Commands to a Go Dashboard CPU Monitoring: From Linux Commands to a Go Dashboard


Karandeep Singh
• 20 minutes
Summary
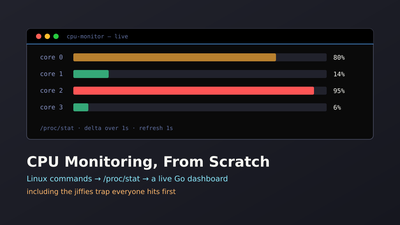
CPU monitoring from command line to Go code — each step shows the Linux command first, then builds it in Go. Hit the jiffies trap, fix it, add colored bars, end with a live dashboard.
Every monitoring tool reads the same Linux files to get CPU data. top, htop, Prometheus node_exporter, Datadog agent — all of them read /proc/stat. But if you open that file, the numbers don’t make sense. They’re not percentages. They’re cumulative counters since boot.
We’ll learn CPU monitoring the way it actually works — start with the Linux command, understand what it shows, then build the same thing in Go. Each step adds one concept. We’ll make mistakes along the way and fix them.
/proc/stat counts since boot, so a single read gives you the machine’s lifetime average — steady, useless, and wrong. Two reads a second apart, subtracted, give you the second that just happened.Prerequisites
- A Linux system (native, WSL, or SSH to a server)
- Go 1.21+ installed
Step 1: How Many Cores Do You Have?
The simplest question. From the command line:
$ nproc4That’s 4 logical cores. But how many are physical? lscpu tells you:
$ lscpu | grep -E "^CPU\(s\)|Thread|Core|Socket"CPU(s): 4Thread(s) per core: 2Core(s) per socket: 2Socket(s): 12 physical cores, hyper-threaded to 4 logical. For CPU-bound work, you have 2 real cores. For I/O-bound work, all 4 help.
Now let’s get this same info in Go. Where does nproc get its number? From /proc/cpuinfo — each processor entry is one logical core.
Create your project:
mkdir go-cpumon && cd go-cpumon
go mod init go-cpumon
main.go
package main

import (
	"bufio"
	"fmt"
	"log"
	"os"
	"strings"
)

func main() {
	file, err := os.Open("/proc/cpuinfo")
	if err != nil {
		log.Fatal(err)
	}
	defer file.Close()

	cores := 0
	scanner := bufio.NewScanner(file)
	for scanner.Scan() {
		if strings.HasPrefix(scanner.Text(), "processor") {
			cores++
		}
	}

	fmt.Printf("logical cores: %d\n", cores)
}
$ go run main.gological cores: 4Same number as nproc. But counting cores doesn’t tell you anything useful during an incident. You need to know how busy they are.
Deepen your understanding in AWS CLI Automation: From Bash Scripts to Go
Step 2: Check CPU Usage — The Quick Way
During an incident, the first command you run:
$ top -bn1 | grep "Cpu(s)"%Cpu(s): 12.5 us, 3.1 sy, 0.0 ni, 83.2 id, 0.8 wa, 0.0 hi, 0.4 si, 0.0 stEvery field matters:
| Field | Means | Worry when |
|---|---|---|
| us | Your app code | High = app is CPU-busy |
| sy | Kernel/syscalls | High = too many context switches |
| id | Idle | Low = CPU is maxed |
| wa | Waiting for disk | High = storage is the bottleneck |
| st | Stolen by hypervisor | High = noisy neighbor on shared VM |
Now let’s try to get the same numbers in Go. The raw data lives in /proc/stat:
$ head -1 /proc/statcpu 234567 890 123456 7890123 4567 0 1234 0 0 0Columns: user nice system idle iowait irq softirq steal guest guest_nice. Let’s read this in Go:
main.go — updated:
package main

import (
	"bufio"
	"fmt"
	"log"
	"os"
	"strings"
)

func main() {
	file, err := os.Open("/proc/stat")
	if err != nil {
		log.Fatal(err)
	}
	defer file.Close()

	scanner := bufio.NewScanner(file)
	for scanner.Scan() {
		line := scanner.Text()
		if strings.HasPrefix(line, "cpu") {
			fmt.Println(line)
		}
	}
}
$ go run main.gocpu 234567 890 123456 7890123 4567 0 1234 0 0 0cpu0 58641 222 30864 1972530 1141 0 308 0 0 0cpu1 58642 223 30864 1972531 1142 0 309 0 0 0cpu2 58641 222 30864 1972530 1141 0 308 0 0 0cpu3 58643 223 30864 1972532 1143 0 309 0 0 0Wait — these aren’t percentages. That 7890123 doesn’t mean 7 million percent. What are these numbers?
Explore this further in Service Health Checks: From curl to a Go Health Monitor
Step 3: The Jiffies Trap
Those numbers are jiffies — cumulative CPU ticks (1/100th of a second) since the system booted. That 7890123 means the CPU has been idle for 7,890,123 ticks since boot. Not useful by itself.
To get actual current usage, you need two readings and calculate the difference. This is the trick every monitoring tool uses. Let’s try it in Bash first:
# Reading 1$ read cpu user1 nice1 sys1 idle1 rest < /proc/stat $ sleep 1 # Reading 2$ read cpu user2 nice2 sys2 idle2 rest < /proc/stat # Delta$ active=$(( (user2 + sys2) - (user1 + sys1) ))$ total=$(( (user2 + nice2 + sys2 + idle2) - (user1 + nice1 + sys1 + idle1) )) $ echo "CPU: $(( active * 100 / total ))%"CPU: 16%That’s close to what top showed (active = us + sy = 12.5 + 3.1 = 15.6, ≈16%). Two readings, one second apart, subtract, divide. Now let’s do this properly in Go — but we’ll make a common mistake first.
main.go — updated (has a bug):
package main

import (
	"bufio"
	"fmt"
	"log"
	"os"
	"strconv"
	"strings"
)

type CPUSample struct {
	User, Nice, System, Idle, IOWait, IRQ, SoftIRQ, Steal uint64
}

func (s CPUSample) Total() uint64 {
	return s.User + s.Nice + s.System + s.Idle + s.IOWait + s.IRQ + s.SoftIRQ + s.Steal
}

func (s CPUSample) Active() uint64 {
	return s.User + s.Nice + s.System + s.IRQ + s.SoftIRQ + s.Steal
}

func readCPU() (CPUSample, error) {
	file, err := os.Open("/proc/stat")
	if err != nil {
		return CPUSample{}, err
	}
	defer file.Close()

	scanner := bufio.NewScanner(file)
	scanner.Scan() // first line is total CPU
	fields := strings.Fields(scanner.Text())

	nums := make([]uint64, 8)
	for i := 0; i < 8; i++ {
		nums[i], _ = strconv.ParseUint(fields[i+1], 10, 64)
	}

	return CPUSample{
		User: nums[0], Nice: nums[1], System: nums[2], Idle: nums[3],
		IOWait: nums[4], IRQ: nums[5], SoftIRQ: nums[6], Steal: nums[7],
	}, nil
}

func main() {
	sample, err := readCPU()
	if err != nil {
		log.Fatal(err)
	}

	// BUG: trying to get percentage from a single reading
	usage := float64(sample.Active()) / float64(sample.Total()) * 100
	fmt.Printf("CPU usage: %.1f%%\n", usage)
}
$ go run main.goCPU usage: 14.7%This looks reasonable, but it’s wrong. Run it again:
$ go run main.goCPU usage: 14.7%Same number. Burn a CPU core and run it again:
$ yes > /dev/null &$ go run main.goCPU usage: 14.8%Barely changed! The number barely moves because it’s the lifetime average since boot, not current usage. Dividing cumulative jiffies gives you an average over hours or days. Useless for detecting what’s happening right now.
Kill the burn: killall yes
Discover related concepts in Adding an AWS Region to Aurora PostgreSQL (Global Database)
Step 4: Fix It With the Delta Trick
The fix: take two readings, one second apart, and compute the difference. This gives you the CPU usage for just that one second.
@@ -7,6 +7,7 @@ "os" "strconv" "strings"+ "time" ) type CPUSample struct {@@ -29,7 +30,7 @@ defer file.Close() scanner := bufio.NewScanner(file)- scanner.Scan() // first line is total CPU+ scanner.Scan() fields := strings.Fields(scanner.Text()) nums := make([]uint64, 8)@@ -44,12 +45,26 @@ } func main() {- sample, err := readCPU()+ prev, err := readCPU() if err != nil { log.Fatal(err) } - // BUG: trying to get percentage from a single reading- usage := float64(sample.Active()) / float64(sample.Total()) * 100+ time.Sleep(1 * time.Second)++ curr, err := readCPU()+ if err != nil {+ log.Fatal(err)+ }++ totalDelta := curr.Total() - prev.Total()+ if totalDelta == 0 {+ fmt.Println("CPU: 0.0%")+ return+ }++ activeDelta := curr.Active() - prev.Active()+ usage := float64(activeDelta) / float64(totalDelta) * 100+ fmt.Printf("CPU usage: %.1f%%\n", usage) }The full listing, for reference:
main.go — updated (fixed):
package main

import (
	"bufio"
	"fmt"
	"log"
	"os"
	"strconv"
	"strings"
	"time"
)

type CPUSample struct {
	User, Nice, System, Idle, IOWait, IRQ, SoftIRQ, Steal uint64
}

func (s CPUSample) Total() uint64 {
	return s.User + s.Nice + s.System + s.Idle + s.IOWait + s.IRQ + s.SoftIRQ + s.Steal
}

func (s CPUSample) Active() uint64 {
	return s.User + s.Nice + s.System + s.IRQ + s.SoftIRQ + s.Steal
}

func readCPU() (CPUSample, error) {
	file, err := os.Open("/proc/stat")
	if err != nil {
		return CPUSample{}, err
	}
	defer file.Close()

	scanner := bufio.NewScanner(file)
	scanner.Scan()
	fields := strings.Fields(scanner.Text())

	nums := make([]uint64, 8)
	for i := 0; i < 8; i++ {
		nums[i], _ = strconv.ParseUint(fields[i+1], 10, 64)
	}

	return CPUSample{
		User: nums[0], Nice: nums[1], System: nums[2], Idle: nums[3],
		IOWait: nums[4], IRQ: nums[5], SoftIRQ: nums[6], Steal: nums[7],
	}, nil
}

func main() {
	prev, err := readCPU()
	if err != nil {
		log.Fatal(err)
	}

	time.Sleep(1 * time.Second)

	curr, err := readCPU()
	if err != nil {
		log.Fatal(err)
	}

	totalDelta := curr.Total() - prev.Total()
	if totalDelta == 0 {
		fmt.Println("CPU: 0.0%")
		return
	}

	activeDelta := curr.Active() - prev.Active()
	usage := float64(activeDelta) / float64(totalDelta) * 100

	fmt.Printf("CPU usage: %.1f%%\n", usage)
}
$ go run main.goCPU usage: 12.3%Now burn a core and test:
$ yes > /dev/null &$ go run main.goCPU usage: 36.8%That’s one core at 100% on a 4-core machine — about 25% plus baseline. Much more responsive than the lifetime average. Kill the burn: killall yes.
Compare with top:
top -bn1 | grep "Cpu(s)"
Numbers should be close. Both read the same file, both use the same delta math.
Uncover more details in Build Image with EC2 Image Builder Components
Step 5: See Which Core Is the Problem
Total CPU at 50% could mean all cores at 50% (healthy), or one core at 100% and three at 0% (stuck thread). You need per-core numbers.
From the command line, mpstat does this:
$ mpstat -P ALL 1 1CPU %usr %nice %sys %iowait %irq %soft %steal %idleall 12.50 0.00 3.12 0.81 0.00 0.38 0.00 83.19 0 15.22 0.00 3.45 1.02 0.00 0.51 0.00 79.80 1 8.73 0.00 2.81 0.65 0.00 0.28 0.00 87.53 2 14.11 0.00 3.22 0.88 0.00 0.42 0.00 81.37 3 11.94 0.00 3.01 0.71 0.00 0.32 0.00 84.02Install it if missing: sudo apt install sysstat.
Quick one-liner to find maxed cores:
mpstat -P ALL 1 1 | awk '$NF < 10 {print "CORE " $1 " at " 100-$NF "%"}'
This prints any core with less than 10% idle. During an incident, this tells you instantly if there’s a single-threaded bottleneck.
Now let’s add per-core to our Go tool. We need to read all the cpuN lines from /proc/stat, not just the first total line:
readCPU becomes readAllCPU, and main loops over every core it finds:
@@ -11,6 +11,7 @@ ) type CPUSample struct {+ Name string User, Nice, System, Idle, IOWait, IRQ, SoftIRQ, Steal uint64 } @@ -22,49 +23,58 @@ return s.User + s.Nice + s.System + s.IRQ + s.SoftIRQ + s.Steal } -func readCPU() (CPUSample, error) {+func readAllCPU() ([]CPUSample, error) { file, err := os.Open("/proc/stat") if err != nil {- return CPUSample{}, err+ return nil, err } defer file.Close() + var samples []CPUSample scanner := bufio.NewScanner(file)- scanner.Scan()- fields := strings.Fields(scanner.Text()) - nums := make([]uint64, 8)- for i := 0; i < 8; i++ {- nums[i], _ = strconv.ParseUint(fields[i+1], 10, 64)+ for scanner.Scan() {+ line := scanner.Text()+ if !strings.HasPrefix(line, "cpu") {+ continue+ }+ fields := strings.Fields(line)+ if len(fields) < 9 {+ continue+ }+ nums := make([]uint64, 8)+ for i := 0; i < 8; i++ {+ nums[i], _ = strconv.ParseUint(fields[i+1], 10, 64)+ }+ samples = append(samples, CPUSample{+ Name: fields[0],+ User: nums[0], Nice: nums[1], System: nums[2], Idle: nums[3],+ IOWait: nums[4], IRQ: nums[5], SoftIRQ: nums[6], Steal: nums[7],+ }) }-- return CPUSample{- User: nums[0], Nice: nums[1], System: nums[2], Idle: nums[3],- IOWait: nums[4], IRQ: nums[5], SoftIRQ: nums[6], Steal: nums[7],- }, nil+ return samples, nil } func main() {- prev, err := readCPU()+ prev, err := readAllCPU() if err != nil { log.Fatal(err) } time.Sleep(1 * time.Second) - curr, err := readCPU()+ curr, err := readAllCPU() if err != nil { log.Fatal(err) } - totalDelta := curr.Total() - prev.Total()- if totalDelta == 0 {- fmt.Println("CPU: 0.0%")- return+ for i, c := range curr {+ p := prev[i]+ totalDelta := c.Total() - p.Total()+ if totalDelta == 0 {+ continue+ }+ usage := float64(c.Active()-p.Active()) / float64(totalDelta) * 100+ fmt.Printf(" %-6s %5.1f%%\n", c.Name, usage) }-- activeDelta := curr.Active() - prev.Active()- usage := float64(activeDelta) / float64(totalDelta) * 100-- fmt.Printf("CPU usage: %.1f%%\n", usage) }The full listing, for reference:
main.go — updated:
package main

import (
	"bufio"
	"fmt"
	"log"
	"os"
	"strconv"
	"strings"
	"time"
)

type CPUSample struct {
	Name string
	User, Nice, System, Idle, IOWait, IRQ, SoftIRQ, Steal uint64
}

func (s CPUSample) Total() uint64 {
	return s.User + s.Nice + s.System + s.Idle + s.IOWait + s.IRQ + s.SoftIRQ + s.Steal
}

func (s CPUSample) Active() uint64 {
	return s.User + s.Nice + s.System + s.IRQ + s.SoftIRQ + s.Steal
}

func readAllCPU() ([]CPUSample, error) {
	file, err := os.Open("/proc/stat")
	if err != nil {
		return nil, err
	}
	defer file.Close()

	var samples []CPUSample
	scanner := bufio.NewScanner(file)

	for scanner.Scan() {
		line := scanner.Text()
		if !strings.HasPrefix(line, "cpu") {
			continue
		}
		fields := strings.Fields(line)
		if len(fields) < 9 {
			continue
		}
		nums := make([]uint64, 8)
		for i := 0; i < 8; i++ {
			nums[i], _ = strconv.ParseUint(fields[i+1], 10, 64)
		}
		samples = append(samples, CPUSample{
			Name: fields[0],
			User: nums[0], Nice: nums[1], System: nums[2], Idle: nums[3],
			IOWait: nums[4], IRQ: nums[5], SoftIRQ: nums[6], Steal: nums[7],
		})
	}
	return samples, nil
}

func main() {
	prev, err := readAllCPU()
	if err != nil {
		log.Fatal(err)
	}

	time.Sleep(1 * time.Second)

	curr, err := readAllCPU()
	if err != nil {
		log.Fatal(err)
	}

	for i, c := range curr {
		p := prev[i]
		totalDelta := c.Total() - p.Total()
		if totalDelta == 0 {
			continue
		}
		usage := float64(c.Active()-p.Active()) / float64(totalDelta) * 100
		fmt.Printf("  %-6s %5.1f%%\n", c.Name, usage)
	}
}
$ go run main.go cpu 12.3% cpu0 15.2% cpu1 8.7% cpu2 14.1% cpu3 11.3%Now burn one core:
$ yes > /dev/null &$ go run main.go cpu 36.8% cpu0 99.2% cpu1 3.1% cpu2 2.9% cpu3 3.4%The same five numbers, drawn:
cpu0 pinned at 99%. The total says 36% but per-core shows the real story — and this is
exactly why a single-threaded process on a 4-core box looks like “36% CPU, plenty of
headroom” right up until it doesn’t. Same thing mpstat shows. killall yes to clean up.
Journey deeper into this topic with Go + Nginx: Deploy a Go API Behind a Reverse Proxy
Step 6: Make It Visual With Colored Bars
Numbers are hard to scan during an incident. Let’s add colored bars — green under 50%, yellow 50-80%, red over 80%. Same idea as htop.
Add this function and update main():
One new function and a rewritten main is the whole change:
@@ -55,6 +55,33 @@ return samples, nil } +func calcUsage(prev, curr CPUSample) float64 {+ totalDelta := curr.Total() - prev.Total()+ if totalDelta == 0 {+ return 0+ }+ return float64(curr.Active()-prev.Active()) / float64(totalDelta) * 100+}++func colorBar(usage float64, width int) string {+ filled := int(usage / 100 * float64(width))+ if filled > width {+ filled = width+ }++ var color string+ switch {+ case usage < 50:+ color = "\033[32m" // green+ case usage < 80:+ color = "\033[33m" // yellow+ default:+ color = "\033[31m" // red+ }++ return color + strings.Repeat("█", filled) + "\033[90m" + strings.Repeat("░", width-filled) + "\033[0m"+}+ func main() { prev, err := readAllCPU() if err != nil {@@ -68,13 +95,14 @@ log.Fatal(err) } - for i, c := range curr {- p := prev[i]- totalDelta := c.Total() - p.Total()- if totalDelta == 0 {- continue- }- usage := float64(c.Active()-p.Active()) / float64(totalDelta) * 100- fmt.Printf(" %-6s %5.1f%%\n", c.Name, usage)+ // Total+ total := calcUsage(prev[0], curr[0])+ fmt.Printf(" TOTAL %s %5.1f%%\n", colorBar(total, 40), total)+ fmt.Printf(" %s\n", strings.Repeat("─", 55))++ // Per-core+ for i := 1; i < len(curr); i++ {+ usage := calcUsage(prev[i], curr[i])+ fmt.Printf(" %-6s %s %5.1f%%\n", curr[i].Name, colorBar(usage, 40), usage) } }The full listing, for reference:
main.go — updated:
package main

import (
	"bufio"
	"fmt"
	"log"
	"os"
	"strconv"
	"strings"
	"time"
)

type CPUSample struct {
	Name string
	User, Nice, System, Idle, IOWait, IRQ, SoftIRQ, Steal uint64
}

func (s CPUSample) Total() uint64 {
	return s.User + s.Nice + s.System + s.Idle + s.IOWait + s.IRQ + s.SoftIRQ + s.Steal
}

func (s CPUSample) Active() uint64 {
	return s.User + s.Nice + s.System + s.IRQ + s.SoftIRQ + s.Steal
}

func readAllCPU() ([]CPUSample, error) {
	file, err := os.Open("/proc/stat")
	if err != nil {
		return nil, err
	}
	defer file.Close()

	var samples []CPUSample
	scanner := bufio.NewScanner(file)

	for scanner.Scan() {
		line := scanner.Text()
		if !strings.HasPrefix(line, "cpu") {
			continue
		}
		fields := strings.Fields(line)
		if len(fields) < 9 {
			continue
		}
		nums := make([]uint64, 8)
		for i := 0; i < 8; i++ {
			nums[i], _ = strconv.ParseUint(fields[i+1], 10, 64)
		}
		samples = append(samples, CPUSample{
			Name: fields[0],
			User: nums[0], Nice: nums[1], System: nums[2], Idle: nums[3],
			IOWait: nums[4], IRQ: nums[5], SoftIRQ: nums[6], Steal: nums[7],
		})
	}
	return samples, nil
}

func calcUsage(prev, curr CPUSample) float64 {
	totalDelta := curr.Total() - prev.Total()
	if totalDelta == 0 {
		return 0
	}
	return float64(curr.Active()-prev.Active()) / float64(totalDelta) * 100
}

func colorBar(usage float64, width int) string {
	filled := int(usage / 100 * float64(width))
	if filled > width {
		filled = width
	}

	var color string
	switch {
	case usage < 50:
		color = "\033[32m" // green
	case usage < 80:
		color = "\033[33m" // yellow
	default:
		color = "\033[31m" // red
	}

	return color + strings.Repeat("█", filled) + "\033[90m" + strings.Repeat("░", width-filled) + "\033[0m"
}

func main() {
	prev, err := readAllCPU()
	if err != nil {
		log.Fatal(err)
	}

	time.Sleep(1 * time.Second)

	curr, err := readAllCPU()
	if err != nil {
		log.Fatal(err)
	}

	// Total
	total := calcUsage(prev[0], curr[0])
	fmt.Printf("  TOTAL  %s %5.1f%%\n", colorBar(total, 40), total)
	fmt.Printf("  %s\n", strings.Repeat("─", 55))

	// Per-core
	for i := 1; i < len(curr); i++ {
		usage := calcUsage(prev[i], curr[i])
		fmt.Printf("  %-6s %s %5.1f%%\n", curr[i].Name, colorBar(usage, 40), usage)
	}
}
$ go run main.go TOTAL ████░░░░░░░░░░░░░░░░░░░░░░░░░░░░░░░░░░░░ 12.3% ─────────────────────────────────────────────────────── cpu0 ██████░░░░░░░░░░░░░░░░░░░░░░░░░░░░░░░░░░░░ 15.2% cpu1 ███░░░░░░░░░░░░░░░░░░░░░░░░░░░░░░░░░░░░░░░ 8.7% cpu2 █████░░░░░░░░░░░░░░░░░░░░░░░░░░░░░░░░░░░░░ 14.1% cpu3 ████░░░░░░░░░░░░░░░░░░░░░░░░░░░░░░░░░░░░░░ 11.3%Green bars for low usage. Burn a core — that bar turns red and fills to 100%.
Enrich your learning with Build Image with EC2 Image Builder Components
Step 7: Make It Live
Right now you run it once and it exits. During an incident, you want it refreshing every second like htop. You could use watch:
watch -n 1 'go run main.go'
But that re-compiles every second. Let’s build the refresh into Go — clear screen, redraw, add a breakdown line showing user/sys/idle/iowait/steal (same fields top shows).
Drawing moves into a render function and main becomes a refresh loop with a Ctrl+C handler:
@@ -5,8 +5,10 @@ "fmt" "log" "os"+ "os/signal" "strconv" "strings"+ "syscall" "time" ) @@ -32,7 +34,6 @@ var samples []CPUSample scanner := bufio.NewScanner(file)- for scanner.Scan() { line := scanner.Text() if !strings.HasPrefix(line, "cpu") {@@ -68,41 +69,71 @@ if filled > width { filled = width }- var color string switch { case usage < 50:- color = "\033[32m" // green+ color = "\033[32m" case usage < 80:- color = "\033[33m" // yellow+ color = "\033[33m" default:- color = "\033[31m" // red+ color = "\033[31m" }- return color + strings.Repeat("█", filled) + "\033[90m" + strings.Repeat("░", width-filled) + "\033[0m" } +func render(prev, curr []CPUSample) {+ fmt.Print("\033[H\033[2J") // clear screen+ fmt.Println(" go-cpumon (Ctrl+C to quit)")+ fmt.Println()++ total := calcUsage(prev[0], curr[0])+ fmt.Printf(" TOTAL %s %5.1f%%\n", colorBar(total, 40), total)+ fmt.Printf(" %s\n", strings.Repeat("─", 55))++ for i := 1; i < len(curr); i++ {+ usage := calcUsage(prev[i], curr[i])+ fmt.Printf(" %-6s %s %5.1f%%\n", curr[i].Name, colorBar(usage, 40), usage)+ }++ // Breakdown — same fields as top+ p, c := prev[0], curr[0]+ td := float64(c.Total() - p.Total())+ if td > 0 {+ fmt.Println()+ fmt.Printf(" user=%.1f%% sys=%.1f%% idle=%.1f%% iowait=%.1f%% steal=%.1f%%\n",+ float64(c.User-p.User)/td*100,+ float64(c.System-p.System)/td*100,+ float64(c.Idle-p.Idle)/td*100,+ float64(c.IOWait-p.IOWait)/td*100,+ float64(c.Steal-p.Steal)/td*100,+ )+ }+}+ func main() {+ sig := make(chan os.Signal, 1)+ signal.Notify(sig, syscall.SIGINT, syscall.SIGTERM)+ go func() {+ <-sig+ fmt.Print("\033[?25h")+ fmt.Println("\nbye")+ os.Exit(0)+ }()++ fmt.Print("\033[?25l") // hide cursor+ prev, err := readAllCPU() if err != nil { log.Fatal(err) } - time.Sleep(1 * time.Second)-- curr, err := readAllCPU()- if err != nil {- log.Fatal(err)- }-- // Total- total := calcUsage(prev[0], curr[0])- fmt.Printf(" TOTAL %s %5.1f%%\n", colorBar(total, 40), total)- fmt.Printf(" %s\n", strings.Repeat("─", 55))-- // Per-core- for i := 1; i < len(curr); i++ {- usage := calcUsage(prev[i], curr[i])- fmt.Printf(" %-6s %s %5.1f%%\n", curr[i].Name, colorBar(usage, 40), usage)+ for {+ time.Sleep(1 * time.Second)+ curr, err := readAllCPU()+ if err != nil {+ log.Fatal(err)+ }+ render(prev, curr)+ prev = curr } }The full listing, for reference:
main.go — updated:
package main

import (
	"bufio"
	"fmt"
	"log"
	"os"
	"os/signal"
	"strconv"
	"strings"
	"syscall"
	"time"
)

type CPUSample struct {
	Name string
	User, Nice, System, Idle, IOWait, IRQ, SoftIRQ, Steal uint64
}

func (s CPUSample) Total() uint64 {
	return s.User + s.Nice + s.System + s.Idle + s.IOWait + s.IRQ + s.SoftIRQ + s.Steal
}

func (s CPUSample) Active() uint64 {
	return s.User + s.Nice + s.System + s.IRQ + s.SoftIRQ + s.Steal
}

func readAllCPU() ([]CPUSample, error) {
	file, err := os.Open("/proc/stat")
	if err != nil {
		return nil, err
	}
	defer file.Close()

	var samples []CPUSample
	scanner := bufio.NewScanner(file)
	for scanner.Scan() {
		line := scanner.Text()
		if !strings.HasPrefix(line, "cpu") {
			continue
		}
		fields := strings.Fields(line)
		if len(fields) < 9 {
			continue
		}
		nums := make([]uint64, 8)
		for i := 0; i < 8; i++ {
			nums[i], _ = strconv.ParseUint(fields[i+1], 10, 64)
		}
		samples = append(samples, CPUSample{
			Name: fields[0],
			User: nums[0], Nice: nums[1], System: nums[2], Idle: nums[3],
			IOWait: nums[4], IRQ: nums[5], SoftIRQ: nums[6], Steal: nums[7],
		})
	}
	return samples, nil
}

func calcUsage(prev, curr CPUSample) float64 {
	totalDelta := curr.Total() - prev.Total()
	if totalDelta == 0 {
		return 0
	}
	return float64(curr.Active()-prev.Active()) / float64(totalDelta) * 100
}

func colorBar(usage float64, width int) string {
	filled := int(usage / 100 * float64(width))
	if filled > width {
		filled = width
	}
	var color string
	switch {
	case usage < 50:
		color = "\033[32m"
	case usage < 80:
		color = "\033[33m"
	default:
		color = "\033[31m"
	}
	return color + strings.Repeat("█", filled) + "\033[90m" + strings.Repeat("░", width-filled) + "\033[0m"
}

func render(prev, curr []CPUSample) {
	fmt.Print("\033[H\033[2J") // clear screen
	fmt.Println("  go-cpumon (Ctrl+C to quit)")
	fmt.Println()

	total := calcUsage(prev[0], curr[0])
	fmt.Printf("  TOTAL  %s %5.1f%%\n", colorBar(total, 40), total)
	fmt.Printf("  %s\n", strings.Repeat("─", 55))

	for i := 1; i < len(curr); i++ {
		usage := calcUsage(prev[i], curr[i])
		fmt.Printf("  %-6s %s %5.1f%%\n", curr[i].Name, colorBar(usage, 40), usage)
	}

	// Breakdown — same fields as top
	p, c := prev[0], curr[0]
	td := float64(c.Total() - p.Total())
	if td > 0 {
		fmt.Println()
		fmt.Printf("  user=%.1f%%  sys=%.1f%%  idle=%.1f%%  iowait=%.1f%%  steal=%.1f%%\n",
			float64(c.User-p.User)/td*100,
			float64(c.System-p.System)/td*100,
			float64(c.Idle-p.Idle)/td*100,
			float64(c.IOWait-p.IOWait)/td*100,
			float64(c.Steal-p.Steal)/td*100,
		)
	}
}

func main() {
	sig := make(chan os.Signal, 1)
	signal.Notify(sig, syscall.SIGINT, syscall.SIGTERM)
	go func() {
		<-sig
		fmt.Print("\033[?25h")
		fmt.Println("\nbye")
		os.Exit(0)
	}()

	fmt.Print("\033[?25l") // hide cursor

	prev, err := readAllCPU()
	if err != nil {
		log.Fatal(err)
	}

	for {
		time.Sleep(1 * time.Second)
		curr, err := readAllCPU()
		if err != nil {
			log.Fatal(err)
		}
		render(prev, curr)
		prev = curr
	}
}
Build and run:
go build -o go-cpumon && ./go-cpumon
Expected output (refreshes every second):
  go-cpumon (Ctrl+C to quit)

  TOTAL  ████░░░░░░░░░░░░░░░░░░░░░░░░░░░░░░░░░░░░  12.3%
  ───────────────────────────────────────────────────────
  cpu0   ██████░░░░░░░░░░░░░░░░░░░░░░░░░░░░░░░░░░░░  15.2%
  cpu1   ███░░░░░░░░░░░░░░░░░░░░░░░░░░░░░░░░░░░░░░░   8.7%
  cpu2   █████░░░░░░░░░░░░░░░░░░░░░░░░░░░░░░░░░░░░░  14.1%
  cpu3   ████░░░░░░░░░░░░░░░░░░░░░░░░░░░░░░░░░░░░░░  11.3%

  user=8.2%  sys=4.1%  idle=87.7%  iowait=0.0%  steal=0.0%
The breakdown line shows the same categories as top -bn1 | grep "Cpu(s)". Now you have a tool that does what htop does for CPU — reading the same files, using the same math.
Gain comprehensive insights from Livestream From Your Phone to AWS with IVS (and What Every Setting Means)
What We Learned
Each step showed the Linux command first, then built it in Go:
| Concept | Linux command | Go equivalent |
|---|---|---|
| Core count | nproc, lscpu | Read /proc/cpuinfo, count processor |
| CPU overview | top -bn1 | Read /proc/stat first line |
| The jiffies trap | cat /proc/stat | Single reading = lifetime average (wrong) |
| Delta calculation | Bash read + sleep + math | Two readAllCPU() calls, subtract |
| Per-core breakdown | mpstat -P ALL | Read all cpuN lines from /proc/stat |
| Visual bars | htop | ANSI colors + █░ characters |
| Live dashboard | watch -n 1 | Clear screen loop + signal handler |
The key insight: /proc/stat numbers are cumulative jiffies, not percentages. Every monitoring tool — Prometheus, Datadog, top, htop, and now yours — uses the delta trick to get real-time usage.
Master this concept through AWS Lambda Configuration Explained: What to Care About (and Why)
Cheat Sheet
Quick CPU checks:
nproc                                    # core count
lscpu | grep "Core(s)"                  # physical cores
top -bn1 | grep "Cpu(s)"               # usage overview
mpstat -P ALL 1 1                        # per-core breakdown
During an incident:
ps aux --sort=-%cpu | head -5            # which process?
mpstat -P ALL 1 1 | awk '$NF < 10'     # which core is maxed?
vmstat 1 3                               # CPU or I/O problem?
uptime                                   # load average trend
The delta trick (Bash):
read cpu u1 n1 s1 i1 r < /proc/stat; sleep 1
read cpu u2 n2 s2 i2 r < /proc/stat
echo "CPU: $(( (u2+s2-u1-s1)*100 / (u2+n2+s2+i2-u1-n1-s1-i1) ))%"
The delta trick (Go):
totalDelta := curr.Total() - prev.Total()
activeDelta := curr.Active() - prev.Active()
usage := float64(activeDelta) / float64(totalDelta) * 100
Key rules to remember:
Delve into specifics at kubectl Cheat Sheet: 30+ Essential Commands
/proc/stathas cumulative jiffies — NOT percentages- Single reading = lifetime average (useless) — always use two readings
Active = user + nice + system + irq + softirq + steal- iowait high = disk is the bottleneck, not CPU
- steal high = hypervisor taking your CPU (noisy neighbor)
- One core at 100% on 4 cores = 25% total — always check per-core
toppress 1 for per-core — most people don’t know thisvmstatcolumn r > core count = CPU bottleneck
Keep Reading
- Process Management: From Linux Commands to a Go Supervisor — use /proc to monitor and manage processes, not just CPU.
- Service Health Checks: From curl to a Go Health Monitor — build a complete monitoring tool that checks CPU, memory, disk, and services.
- Advanced Guide to Using the top Command in Linux — master the interactive tool that reads the same /proc data.
Question
How do you monitor CPU on your servers? Prometheus, Datadog, custom tooling, or just top?
Similar Articles
Related Content
More from devops
Atuin replaces your shell history with a searchable database: fuzzy matching, filter by directory, …
Cut AWS Lambda cost: what you are actually billed for, why more memory is rarely cheaper, the exact …
You Might Also Like
Design an AWS Lambda system for a million users an hour: capacity math, concurrency, cold starts, …
Practical sed patterns for log analysis: extract errors, filter time ranges, anonymize PII, parse …
Contents